
 April 12, 2016
by Matthew Mattingly
Low pricing has been much the talk over the last few years in the energy industry. Low prices started in the natural gas industry, moved to natural gas liquids (ethane, propane, or anything else that ends with -ane), and finally hit the oil markets at the end of 2014. The drop in pricing for drill bit hydrocarbons (DBHs) is a direct result of the shale revolution and the excess supply that has entered the market. However, pricing isn’t the only thing dropping. Low DBH pricing has meant rig counts are dropping as well, and they have been dropping at a steady pace. In this blog entry, we will take a closer look at the decline in rig counts and the effects, if any, it will have on production. But before we get started, let’s get in the mood with some lyrical poetry from Ludacris.
The Baker Hughes rig count report has traditionally been the barometer for drilling activity in North America. Historically when the report has shown a rise/fall of rigs it correlated with the rise/fall of production for oil and natural gas. As a result, the rig count was looked at nearly as closely as EIA storage report for natural gas.
Over the last couple years the Baker Hughes rig report has seen some large shifts in rig count numbers. At the start of the shale revolution the focus was on natural gas, representing over 70% of total rigs in the US Rig Count. However, as natural gas pricing plummeted and new shale technologies improved the shift of drilling activity was moved to oil. By 2012, oil specific rigs represented 70% of the total rigs in the US Rig Count and oil has not relinquished its large majority stake in this report since. The reason for the shift was simple; natural gas was trading under $4/MMBtu, while oil was trading over $100/BBl ($17.25/MMBtu equivalent). Producers were just following the money. However, in late 2014 there wasn’t any more money to follow. Oil pricing followed the same path of other DBHs commodity prices, and fell dramatically due to the excess supply. With oil and natural gas prices at historic lows, rig counts followed the same path and it which continues today.
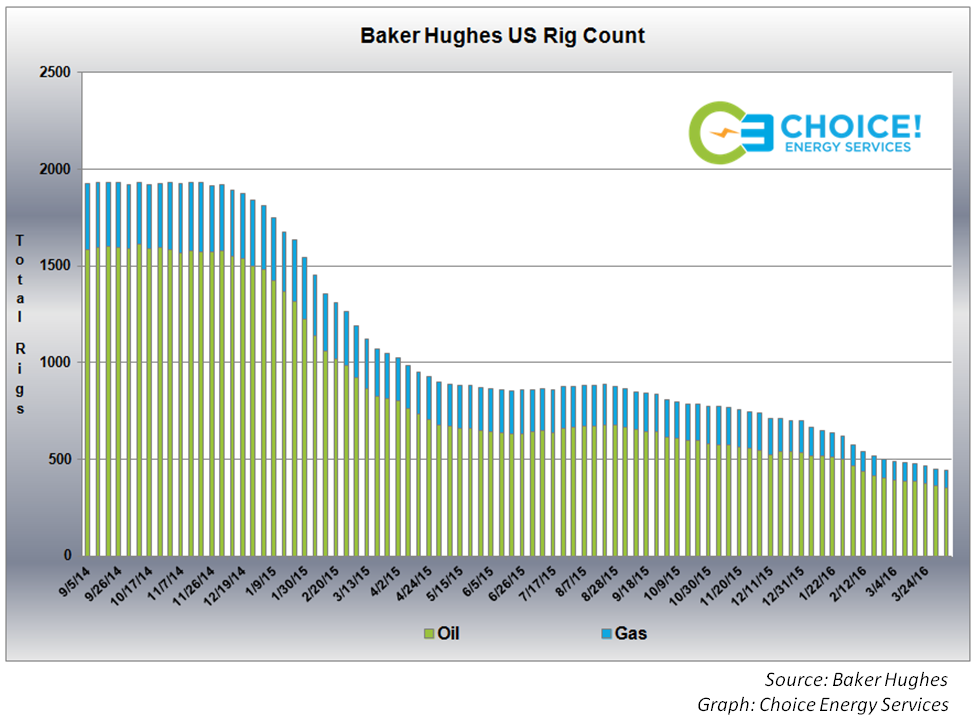
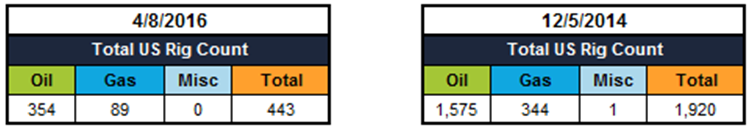
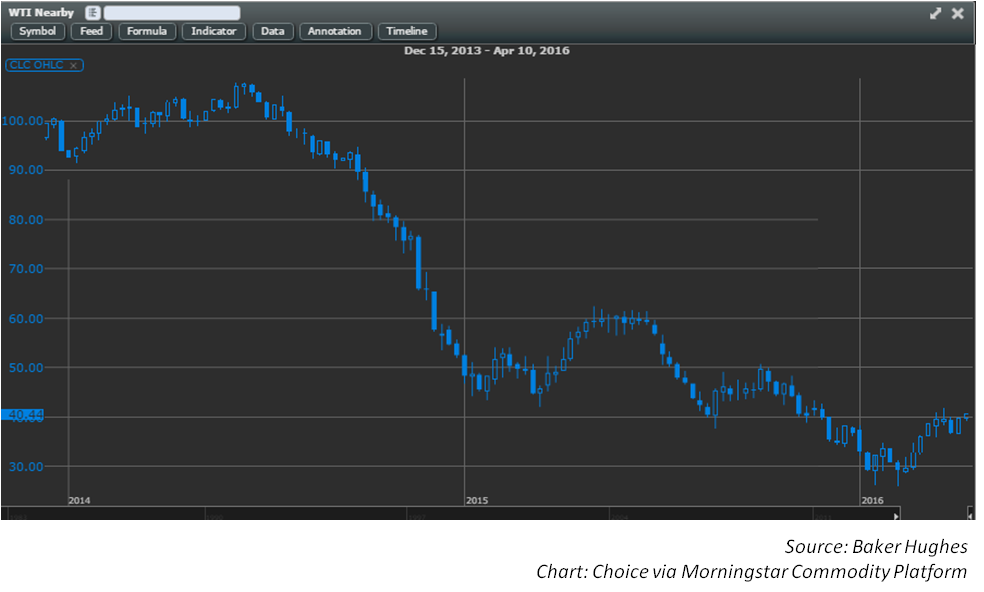
The graph above illustrates the vast drop in rig counts for both oil and natural gas that started in late 2014 and continues today. It also coincides nearly perfectly with WTI Crude Nearby price curve listed below. However, unlike oil prices, there hasn’t been much of a rebound in the rig count totals. Nearly each new week brings a new low in rig counts. The latest rig report from 04/08/2016 had a total rig count of 443 rigs which is the lowest total number of rigs since the Harry S Truman administration (“my parents were big fans of the former president”-Fletch). In comparison, the rig count at the end of 2014 totaled 1,920. In 16 short months we have seen a 77% decline in total rigs and each week seems to bring a new low.
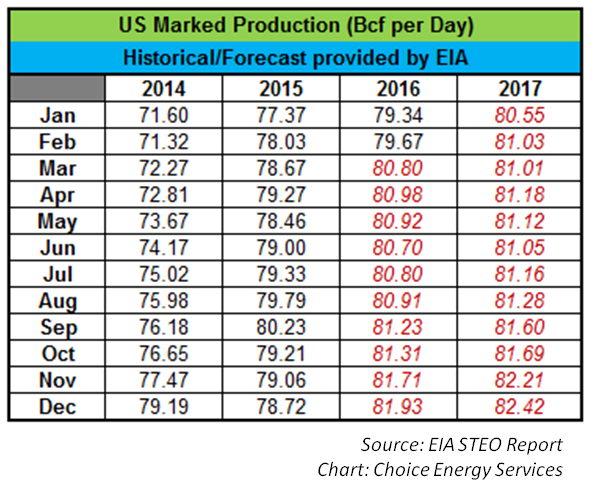
As previously mentioned, historically the rig count was closely monitored as a fundamental market driver given that the rise/fall of rigs correlated with the rise/fall of production. But that is no longer the case in the shale era. Even with the rig counts dropping nearly every week, production has risen or at least maintained levels. Technology improvements, pad drilling, and sweet spot exploration has allowed producers to maintain production levels while cutting back on exploratory rigs in search of new energy resources. The EIA is even predicting natural gas production levels will remain strong in 2016 and 2017 (see chart below).
So with natural gas production continuing to rise in the face of falling rig counts, should we even care about rig counts anymore? The answer is a classic Yes and No. The shale revolution has brought technological advances to production that looking at historical rig counts will not provide any correlation to future drilling production whatsoever. BUT there still has to be a number of rigs in the ground drilling for future production wells. How many rigs are needed to maintain production has been tough to determine. Rig counts dropped dramatically in 2015, but plateaued midway through the year. Then the decline started back at the end of last year and has continued the slow and steady decline to only 443 total rigs. The latest decline could be due to continued technological advances, or it could finally be a sign that producers are cutting back in the low price environment. If production is not deterred after the latest decline, then we must wonder, how low can the rig count go?
Confidential: Choice Energy Services Retail, LP.