My Friend, Is This Really a Revolution?

by Matthew Mattingly & Will Nash

If you are in the energy industry, a term you hear on a daily basis is “shale revolution.”  The shale revolution describes the the technological advancement in hydrocarbon (oil, natural gas, NGLs) drilling that allows drillers to remove hydrocarbons from shale rock in a cost effective manner.  This new way of pulling natural gas and oil out of the ground has led to a fall in commodity prices that end-users are taking advantage of today. However, I am not here to discuss hydraulic fracturing or commodity prices in the United States. There are countless articles that are written everyday discussing that subject. However, what I am hear to talk about is the term “Revolution.” Call it a complaint or simply just a pet peeve, but the shale “revolution” sounds a bit too dramatic. The Colonial States breaking away from Britain was a revolution. The French overthrowing their monarchy was a revolution. An alternative way to drill for oil and natural gas doesn’t seem to fit the revolution profile.

I am likely in the minority in this thinking, because the term “shale revolution” has become industry standard. Not only is the term used in industry articles and websites, but it is also the title of several books…

  1. The Green and the Black: The Complete Story of the Shale Revolution, the Fight over Fracking, and the Future of Energy By: Gary Sernovitz
  2. The Shale Energy Revolution: A Lawyer’s Guide By: America Bas Association
  3. After the US Shale Gas Revolution By: Thierry Bros
  4. Meet the New Frackers: A Landowner’s Guide for Successfully Navigating the Ever-Changing Shale Revolution (Volume 2) By: Thomas R Clay
  5. The Shale Gas Revolution By: Vincent J Lentini
  6. Shale Revolution0: How North America’s shale gas and tight oil plays are recalibrating to a more competitive environment By: Tom Haywood and Rachael Seely

However, when I google the definition of revolution (see below), it doesn’t seem hydrocarbon drilling fits the bill. The definition below uses examples of the American Revolution or Marxism that led to triumph of Communism to describe a revolution. These were dramatic changes that people lost their lives for, to overthrow a government or a way of thinking. These events altered history and still change the way society lives today, not just for that period of time. Not sue the same can be said for an alternative way to drill for oil and natural gas. Granted, the last definition example listed below does describe a marketing revolution as dramatic wide-reaching change; it seems out of place compared to the first two examples.

revolution

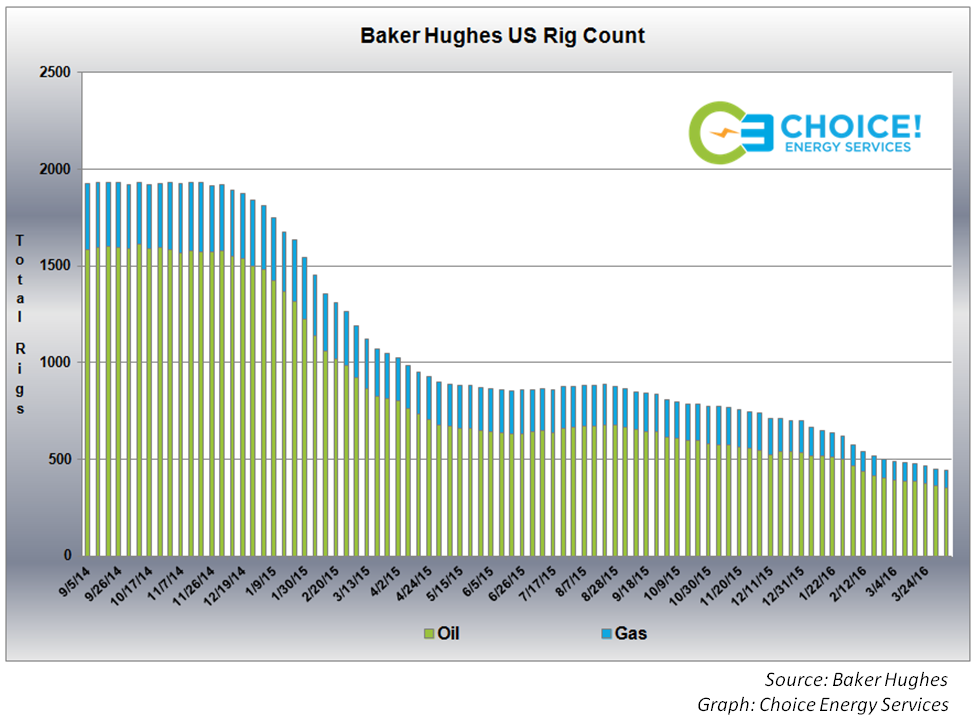
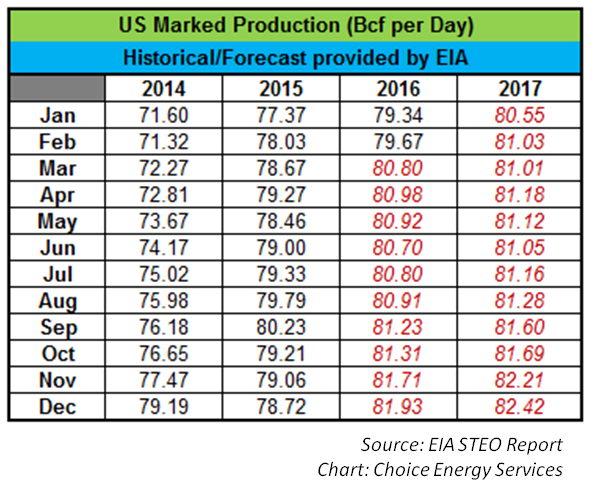
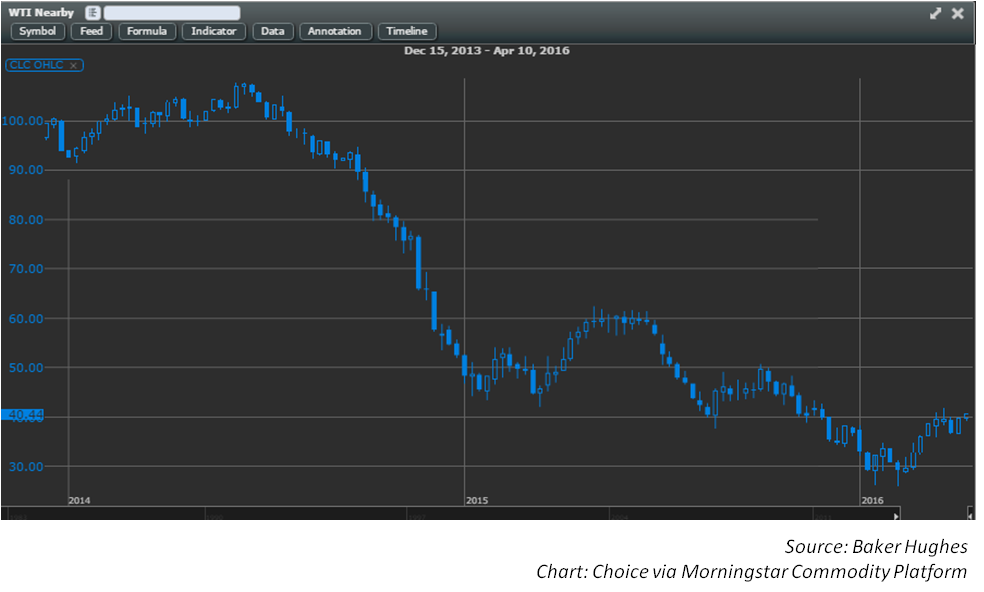
A better way to describe the transformation in drilling process is “Golden Era of Energy Commodities.” A period of time where the United States has benefited from ample supply due to hydraulic fracturing.  This is especially true for natural gas. A commodity that went from shortfalls a decade ago to plentiful supplies in 2010 that still continues today. The excess supply of natural gas has led to collapse in natural gas prices, growth in new natural gas generation (replacing coal generation), new pipeline take-away capacity, increasing natural gas exports to Mexico, and LNG exportation to Asia and South America. Natural gas is the “hot” commodity in energy industry, but this hot commodity will only be a bridge to other alternative or green energy sources that is needed for the future. Thus, this time can only be considered a golden era for natural gas and other hydrocarbon fuels. Ample supplies will be here for now, but they will not impact our country forever.

Therefore going forward, let us all try to use the proper term to describe the transformation in the commodity drilling process. Remember it is not a revolution, but a golden era where end-users are benefiting from plentiful supply at reduced prices.

Off Topic

This blog entry discusses the “shale revolution” but the phrase always makes me think about the “industrial revolution.”  The industrial revolution was beautifully described by Adam Sandler in the movie Billy Madison (jeopardy scene). Billy’s definition of the industrial revolution is shown below, but I changed the word “industrial” out for “shale,” amazingly the description has about the same effectiveness for either topic.

 Billy Madison 1995

“OK. The (Shale) Revolution to me is just like a story I know called ‘The Puppy Who Lost His Way’. The world was changing and the puppy was getting bigger….so you see the puppy was like (Shale) in that they were both lost in the woods. And nobody, especially the little boy (society), knew where to find him. Except that the ‘Puppy’ was a dog. But the (shale) , my friend.. that was a revolution.”

billymadison2

Don’t Call it a Comeback…Just Yet (Rig Counts)

by Matthew Mattingly

Over the last year or so, a hot topic in the natural gas and oil industry is U.S. rig counts. Rig counts have fallen dramatically over the last 18 months coinciding with the collapse of oil prices. Each new week brought a new low, finally hitting a bottom of 404 total rigs just a few a weeks ago. However, after seeing week over week declines for the past 18 months the Baker Hughes U.S. Rig Count report has seen increases over the past three weeks. While neither Chassociated gas supply will be impacted as welloice Energy Services nor the ageless LL Cool J is ready to call it a comeback just yet for rig counts, the recent bullish move in commodity prices could signal a change in direction for rig counts.

As a recap, let’s remember that the Baker Hughes rig count report has traditionally been the barometer for drilling activity in North America. Historically when the report has shown a rise/fall of rigs it correlated with the rise/fall of production for oil and natural gas. But the way we look at rig counts has changed due to the shale revolution. Technology improvements, pad drilling, and sweet spot exploration have allowed producers to maintain production levels while cutting back on exploratory rigs in search of new energy resources. Choice Energy Services wrote about this fundamental change in the natural gas market in a blog entry titled “How Low Can It Go?-Rig Counts.”

The main question that was raised in the previous blog entry …when will rigs return?  Choice Energy Services discussed in the last Bulls & Bears Report that rig counts could return if oil prices consistently trade in the $45-$50/Bbl range.  See excerpt below from the report…

Producers are looking for oil to be consistently in the $45- $50/Bbl to bring rigs back on line, and current pricing is not too far away from that target range. Thus, if oil prices move up, rigs counts will increase, and more associated natural gas will become available. Additional supply will continue to keep natural gas prices deflated. However, if the opposite occurs and oil prices revert back to $30/Bbl, rigs counts will continue their further decline, and the impact of associated gas supply will be impacted as well.” –  NYMEX Update – Bulls & Bears Report

Since that report was written, oil prices have moved up.  Over the past month oil has traded in the $45-$50/Bbl range and even broke through the $50 resistance level for a couple of trading sessions. See WTI prompt month pricing below…

Blog 12 - Morningstar graph

As predicted, rig counts have started to rise with the increase in oil prices. After bottoming at 404 rigs on 05/20/2016, the rig count report has risen to 424 total rigs as of 06/17/2016. While this is just a small move, it is at least a move in the opposite direction. Furthermore, producers now have additional motives to put rigs in the ground due to the recent bullish momentum in natural gas prices. The July 2016 NYMEX contract has increased by 27% over the last few weeks, trading currently at $2.747/MMBtu. During the same time Calendar 2017 NYMEX strip pricing has increased by $0.12/MMBtu, now trading at $3.106/MMBtu. Therefore the increase we are seeing in rig counts for oil could start seeing could seeing its way to natural gas rig counts as well.

US Rig Count

It would be very premature to say that rig counts will continue this weekly climb, the increases have only occurred over the past three weeks. Thanks to bullish movements in the energy commodities market over the last month there is finally a reason to add exploratory rigs in the ground. But don’t call it a comeback just yet, rig counts still have a long way to go to match the levels of previous years, but at least it’s a change in direction for the weekly rig count.

US Rig Count Graph


Confidential: Choice Energy Services Retail, LP.

How Low Can it Go? – Rig Counts

by Matthew Mattingly

Low pricing has been much the talk over the last few years in the energy industry. Low prices started in the natural gas industry, moved to natural gas liquids (ethane, propane, or anything else that ends with -ane), and finally hit the oil markets at the end of 2014. The drop in pricing for drill bit hydrocarbons (DBHs) is a direct result of the shale revolution and the excess supply that has entered the market. However, pricing isn’t the only thing dropping. Low DBH pricing has meant rig counts are dropping as well, and they have been dropping at a steady pace. In this blog entry, we will take a closer look at the decline in rig counts and the effects, if any, it will have on production. But before we get started, let’s get in the mood with some lyrical poetry from Ludacris.

The Baker Hughes rig count report has traditionally been the barometer for drilling activity in North America. Historically when the report has shown a rise/fall of rigs it correlated with the rise/fall of production for oil and natural gas. As a result, the rig count was looked at nearly as closely as EIA storage report for natural gas.

Over the last couple years the Baker Hughes rig report has seen some large shifts in rig count numbers. At the start of the shale revolution the focus was on natural gas, representing over 70% of total rigs in the US Rig Count. However, as natural gas pricing plummeted and new shale technologies improved the shift of drilling activity was moved to oil. By 2012, oil specific rigs represented 70% of the total rigs in the US Rig Count and oil has not relinquished its large majority stake in this report since. The reason for the shift was simple; natural gas was trading under $4/MMBtu, while oil was trading over $100/BBl ($17.25/MMBtu equivalent). Producers were just following the money. However, in late 2014 there wasn’t any more money to follow. Oil pricing followed the same path of other DBHs commodity prices, and fell dramatically due to the excess supply. With oil and natural gas prices at historic lows, rig counts followed the same path and it which continues today.

Baker Hughes US Rig Count

The graph above illustrates the vast drop in rig counts for both oil and natural gas that started in late 2014 and continues today.  It also coincides nearly perfectly with WTI Crude Nearby price curve listed below. However, unlike oil prices, there hasn’t been much of a rebound in the rig count totals. Nearly each new week brings a new low in rig counts. The latest rig report from 04/08/2016 had a total rig count of 443 rigs which is the lowest total number of rigs since the Harry S Truman administration (“my parents were big fans of the former president”-Fletch). In comparison, the rig count at the end of 2014 totaled 1,920. In 16 short months we have seen a 77% decline in total rigs and each week seems to bring a new low.


US Rig Count Decline


As previously mentioned, historically the rig count was closely monitored as a fundamental market driver given that the rise/fall of rigs correlated with the rise/fall of production. But that is no longer the case in the shale era. Even with the rig counts dropping nearly every week, production has risen or at least maintained levels. Technology improvements, pad drilling, and sweet spot exploration has allowed producers to maintain production levels while cutting back on exploratory rigs in search of new energy resources. The EIA is even predicting natural gas production levels will remain strong in 2016 and 2017 (see chart below).

US Marked Production (Bcf per Day)

So with natural gas production continuing to rise in the face of falling rig counts, should we even care about rig counts anymore? The answer is a classic Yes and No. The shale revolution has brought technological advances to production that looking at historical rig counts will not provide any correlation to future drilling production whatsoever. BUT there still has to be a number of rigs in the ground drilling for future production wells. How many rigs are needed to maintain production has been tough to determine. Rig counts dropped dramatically in 2015, but plateaued midway through the year. Then the decline started back at the end of last year and has continued the slow and steady decline to only 443 total rigs. The latest decline could be due to continued technological advances, or it could finally be a sign that producers are cutting back in the low price environment. If production is not deterred after the latest decline, then we must wonder, how low can the rig count go?


How low can the rig count go


Confidential: Choice Energy Services Retail, LP.