Independence Day: The Natural Gas Market

via GIPHY

The only thing that could make 2020 more unbelievable would be massive alien saucers hovering over major US cities. COVID-19 continues to linger, election rhetoric is heating up, and NYMEX Natural Gas just broke the record for its LOWEST MONTHLY PRICE SETTLEMENT IN 25 YEARS. With the July contract settling at $1.495/MMBtu, preconceived notions about this market have been shattered, and we face the rest of 2020 with a high degree of uncertainty. Can Will Smith swoop in and end this alien-like hold the bearish fundamentals have on this market? To be determined, but what is certain is that this natural gas market is sending up fireworks of the likes never seen.

2020 was supposed to be the year of growth for all things natural gas. Growth expected on the demand side from electric power burn, liquefied natural gas (LNG) exportation, and pipeline exports to Mexico. Growth in production expected to make up for the new demand. Rather, what we have seen is a COVID-19 induced, massive decline in nearly every fundamental. LNG is down 70% from projections, production down 10% and industrial demand down almost 20% has given us a slowly balancing but still over-supplied market. This supply glut hangs over the global natural gas market like an ominous flying saucer and poses a serious financial risk to all that dare oppose it.

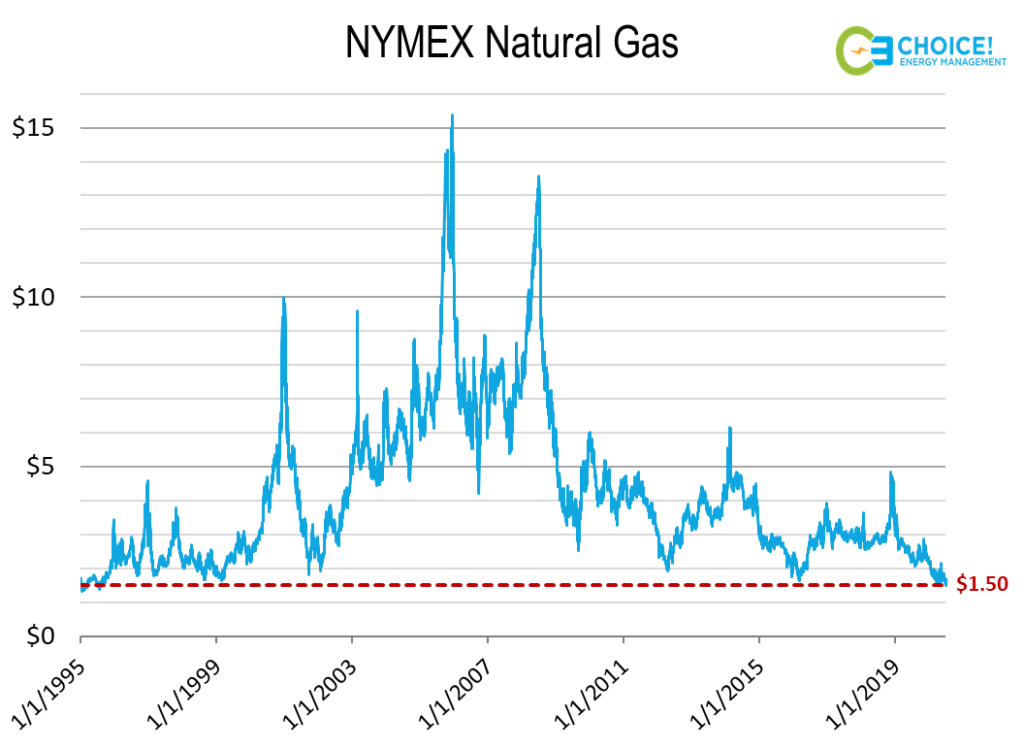
So, what of this pricing record? Last week we saw a massive injection of 120 BCF of natural gas into storage, exceeding expectations and all previous norms. This event, coupled with the fundamentals discussed, and moderating weather forecasts last week, pushed the NYMEX July contract to a low of $1.432 before settling last Friday at $1.495. This is the lowest settlement we have seen since the August 1995 contract that settled at $1.49 (a year before the cinematic classic we call Independence Day was released in theaters). These are price levels previously believed unreachable in our modern market. This bearish confluence of events has moderated, and we have now seen a rebound in the August contract to $1.70 on forecasts of a top 5 hottest July.

In many ways, the NYMEX Natural Gas market is a victim of its own success. The ability to quickly and cheaply produce natural gas has pushed producers to sell at rock-bottom prices. These market prices are unsustainable for long periods of time without irrational factors at play, but there has yet to be much rationality in the year 2020. In a way, maybe the crude 1990’s cinematography and plot line of aliens coming to harvest the earth for its natural resources is a believable analogy for this natural gas market. Will the market shake out by winter? We have our predictions, but for now, we are left waiting for the rest of this market/movie to unfold.

Confidential: Choice Energy Services Retail, LP.

Strange Times: Natural Gas Storage Level

By: Chris Amstutz

The fall season inherently breeds uncertainty. Questions like, will the weather be 80 degrees and sunny, or 50 and rainy? Should I pay money to have someone scare me, or just sit at home and let the evening news do it? Or the most important, troubling question of them all, will natural gas storage levels be at unsustainably low levels to start the winter? The natural gas market is experiencing strange times. We are seeing some fundamentals experience record highs, and some record lows. Whether you’re familiar with the hit Netflix drama Stranger Things or not, there is a similarity between the show’s eerie drama, and the market movements that are being spurred by low natural gas storage levels. The fall season is full of questions, but wondering if your business is protected from potentially volatile NYMEX price movements this winter should not be one of them.

Whether you long for the nostalgic 1980 time period of the show, or a storage inventory level over 4,000 BCF, our situation is grave to say the least. We currently sit at a storage level of 2,956 BCF. That is 607 BCF below the five-year average, and 627 BCF below last year. We started the injection season at 1,281 BCF in storage, but bearish sentiments were abounding at the time with production setting new records then, and nearly every week since (7-12 BCF/Day above the five year average). Unfortunately, several summer fundamentals, previously discussed in our Bulls and Bears Reports, made up that difference on the demand side, preventing the needed storage injections. Similar to Dart the underfed pollywog, we have only averaged a weekly injection of 81 BCF this year, as opposed to the five-year average of 82 BCF. The EIA expects the storage level to get up to 3,263 BCF (lowest level since 2005), but many projections are lower.

So what is the implication of the natural gas market being in the ‘Upside down’ world? In a word, volatility. For most of 2018 we have seen intraday prompt month trading ranges of 5-10 cents. This has now increased to 10-15 cent ranges, and could become larger the closer we get to winter. The NYMEX 2019 Calendar strip has increased $0.20/MMBtu in the last month, on concerns for this winter. Supply constricted areas such as the Northeast and West Coast may experience even larger swings, depending upon the weather. While there is always the chance for this situation to moderate in the coming weeks, the fear of the unknown is currently showing up as a premium in pricing for this winter.

This time of year does not have to be genuinely scary, especially for those dependent upon the natural gas market. Whether storage levels or production records are in control, the market fundamentals are always in flux, and it takes a trained analyst to see what’s coming next. With a flexible, comprehensive suite of energy management solutions, Choice Energy Services can help you keep the natural gas market demogorgons at bay.

Confidential: Choice Energy Services Retail, LP.

Just The Facts, Give Me The Facts!

By: Matthew Mattingly

Alright, so we heard you loud and clear. You love the information in the Bulls & Bears report, but you don’t have time to read the full report.  You need something quick and you need something easy. That way you can get back to what you do best…your job. Which is why the analysts at Choice Energy Services have created the Weekly Market Update. A simple one page report that gives our Risk Management clients the latest fundamental information on the NYMEX natural gas market.

The Weekly Market Update provides graphical information for the following…

  1. NYMEX Candlestick Chart – Follow movement of the NYMEX natural gas prompt market over the last 30 days.
  2. EIA Storage Report – Review the year-to-date working gas storage information in comparison to the five-year average. The graph also includes a three-week forecast of the EIA storage report.
  3. Baker Hughes Rig Count Report – Track the exploratory rig counts for both natural gas and oil over the last 12 months.
  4. Temperature Forecast – See NOAA’s short term temperature forecast, 6-10 days, for the continental United States.

While it may not tell the entire story, these four items give the reader the 101 basics on the NYMEX natural gas market. Just like Cliff’s Notes (here’s a link for you millennials) got you through most of your college career, the Weekly Market Report provides enough information to keep you educated on the NYMEX market. For more explanation on any of these fundamentals, do not hesitate to reach out to any of our market analysts.

What does the mean for the Bulls & Bears report? Fans of this report don’t need to fret, as the detailed monthly report will still be provided to our Risk Management clients. While fans wait for their next monthly installment of the Bulls & Bears they are supplemented with our quick and easy Weekly Market Update. Truly a win-win for everyone!

Confidential: Choice Energy Services Retail, LP.