Energy Markets in the Tunnel of Terror

“There’s no earthly way of knowing.. which direction we are going.. there’s no knowing where we’re rowing.. or which way the river’s flowing

Oh how fast everything can change in our new modern world! A month ago we were innocently dissecting theoretical outcomes of political energy agendas, and now we are quarantined in our homes listening to others debate whether “the economic cure is worse than the disease”. We digress back to the energy markets, and back to the early 70’s when Gene Wilder in Willy Wonka and the Chocolate Factory was entertaining those going through the first OPEC oil price shock. You cannot help but laugh when watching the famous “Tunnel of Terror” scene thinking in context of what has occurred in 2020 so far. Energy markets have experienced a supply shock from OPEC, a demand shock from COVID-19, a wealth shock in the stock market, AND a credit shock from bank lending, all in a matter of 4 weeks. The fact is that any one of these shocks is capable of sending a well-informed business into chaos, but all 4 together is ludicrous. So before you throw your hands in the air and irrationally exit the psychedelic, tunnel-of-terror riverboat, lets dissect this situation, and ride this crazy boat to the golden geese on the other side.

WTI Crude

  • Down 63% since 2/20/20 to $20.
  • OPEC, Russia and US producers all continue maximal oil production, even as oil demand has dropped an estimated 20% year over year due to COVID-19.
  • Diplomatic and pandemic news will be the only short-term catalyst for this market. Watch for the US to first make a diplomatic and then a potentially stronger economic approach with Saudi Arabia, as many lawmakers have already accused them of “Economic warfare”.

Economy

  • Dow Jones down 25% since 2/20/20 to 22,000.
  • Congress has approved a stimulus package and this will look to curb economic uncertainty fears.
  • The Federal Reserve has taken unprecedented action to ensure credit doesn’t tighten, even as board members predict “scary” outcomes of 30% unemployment.
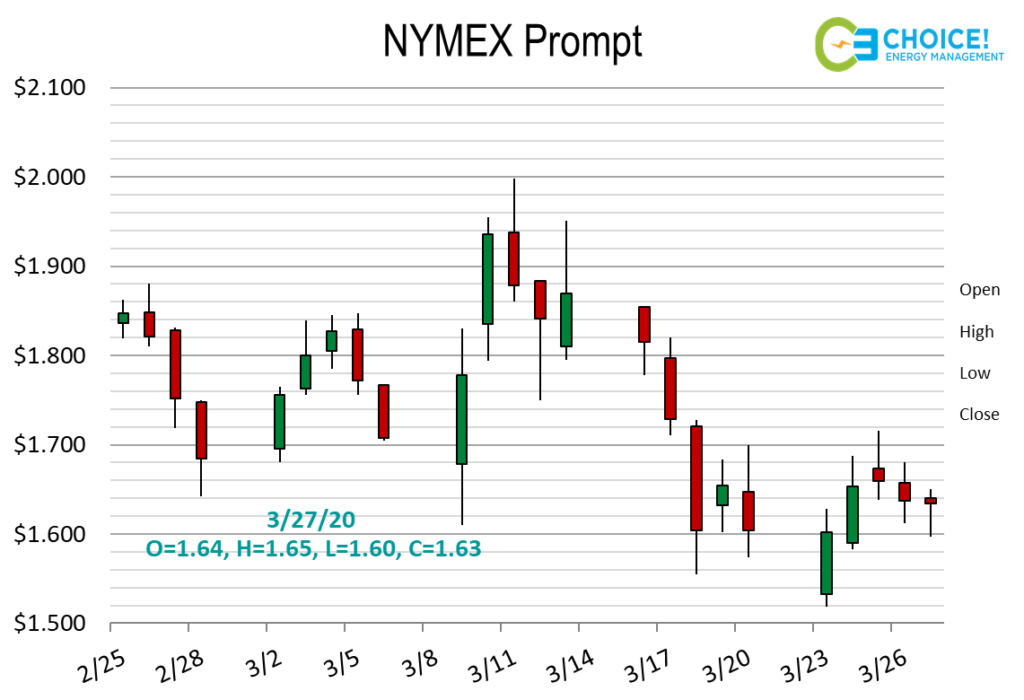
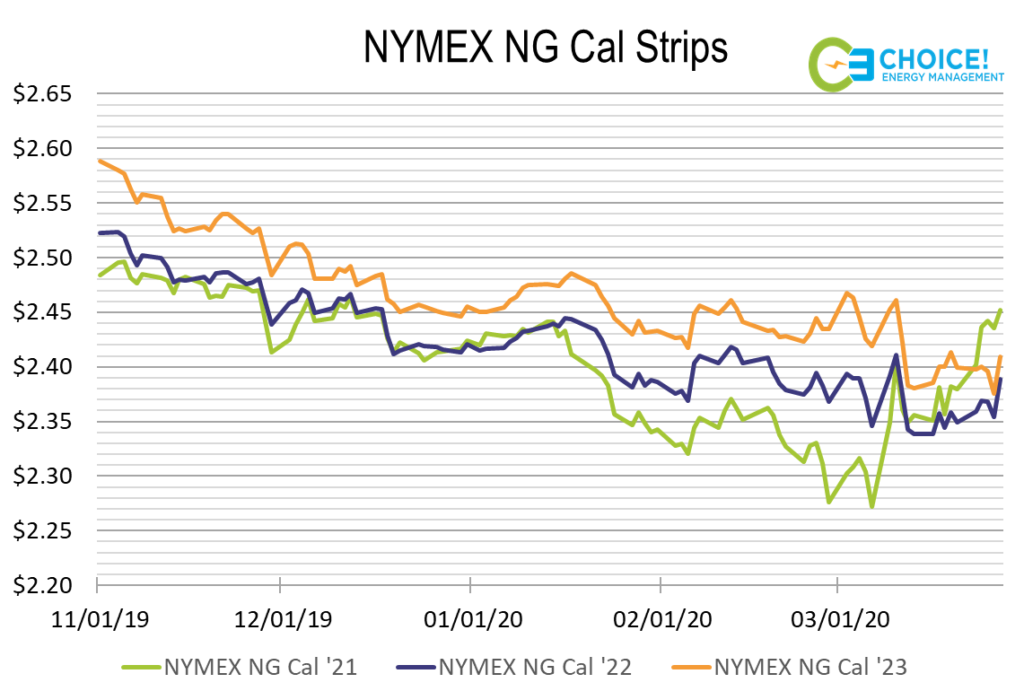
NYMEX Natural Gas

  • NYMEX Prompt down 15% to inflation adjusted all time low of $1.634.
  • The May contract could fall further if we see a decrease in quarantine-driven commercial demand and continued below average weather-driven demand.
  • The calendar ’21 strip price has risen 15 cents off the bottom, potentially due to decreased production outlooks.
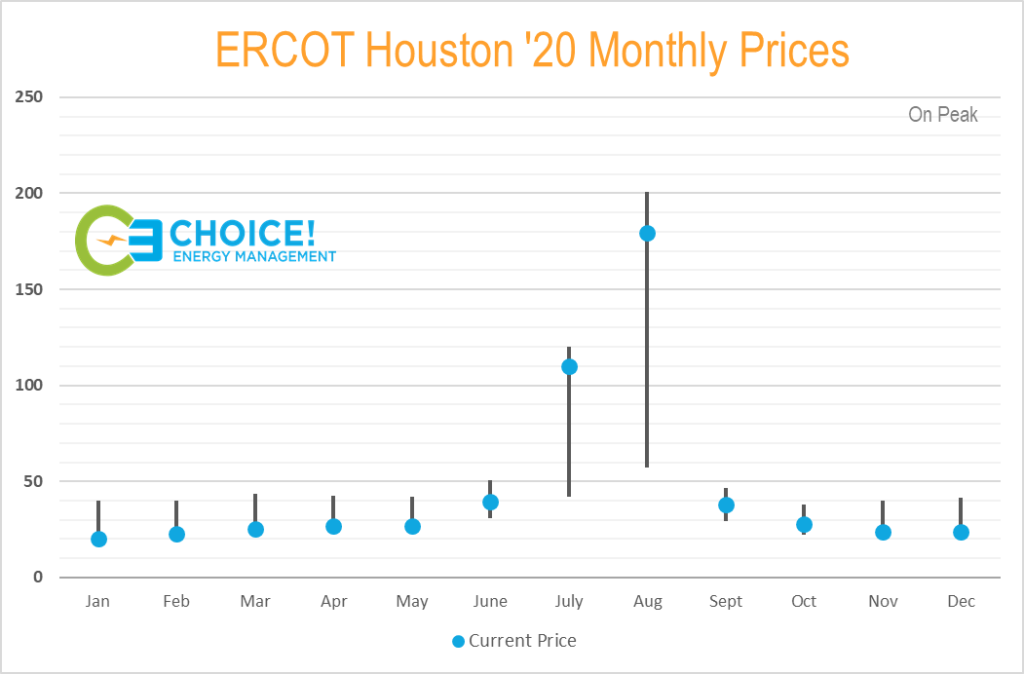
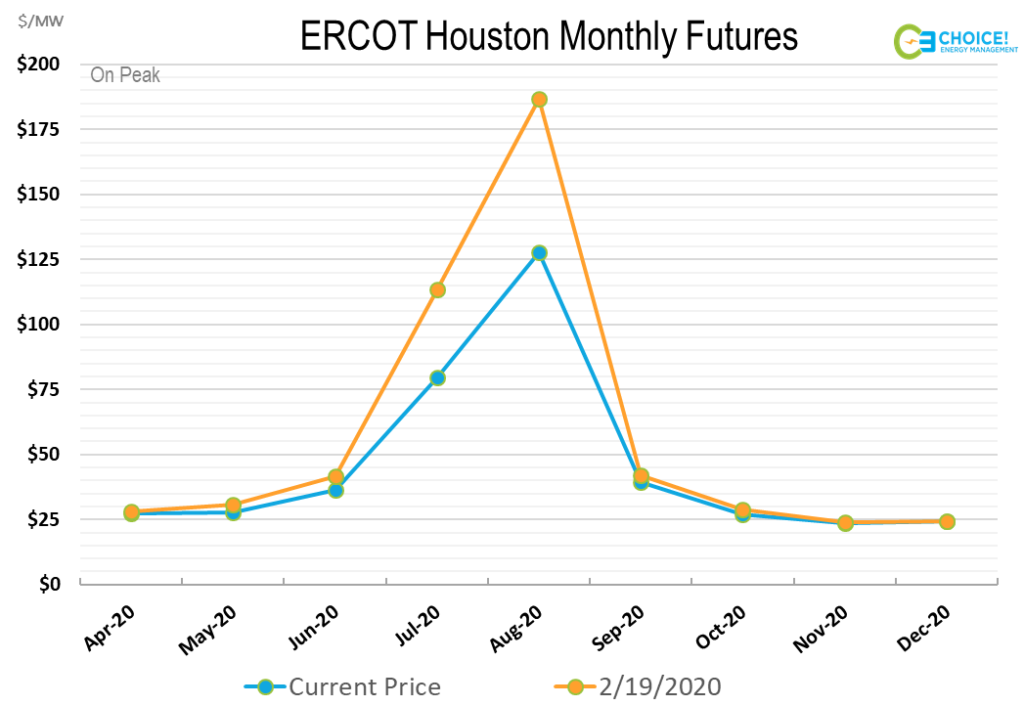
Power Prices

  • Summer 2020 ISO Power Prices are down 20-30% nationwide.
  • New York is reporting power demand 5% below 2019 weather-adjusted levels.
  • ERCOT has seen no clear impacts to demand at this time but the ’20 summer strip in Texas is coming down from all-time highs.

Energy Sector Health

  • The Dallas Federal Reserve energy sector vitality survey hit its lowest score recorded in its 4-year history.
  • Optimism is low from energy producers at current price levels.
  • If the current situation persists longer than 4-6 months, we could see producers go bankrupt.  This disruption would send current supply levels lower for Oil and Natural Gas.

Policy Update

  • As of last declaration from President Trump, COVID-19 containment protocol is recommended to stay in place through April 30, meaning demand destruction and general uncertainty could continue for another month.

If Choice! Energy Management had floated the idea of all of these events occurring simultaneously two months ago, we would have been branded crazier than the idea of a magic chocolate factory. There is no historical event to compare this situation to and the energy markets were already in uncharted waters. For this reason, it could be an opportunistic time for businesses with the means to capitalize on future market positions. A black swan type event, like what we have seen this past month, reinforces the idea of needing a sound energy risk management action plan in place for a business. The gamble is too large. While current events have depressed commodity prices (generally good for businesses), it is no longer impossible to imagine a scenario where prices rise and cost businesses billions in unprotected energy costs. Balancing a businesses risk tolerance with sound fundamental and technical knowledge of energy markets should be the golden goose your business seeks to attain. At Choice! Energy Management we pride ourselves on leading our clients through all energy landscapes (no matter how ominous). Please feel free to reach out for energy help during these trying times, and above all else, look out for each other on this crazy river boat ride we call life.

Confidential: Choice Energy Services Retail, LP.

Choppy Waters: Power Market Volatility

By: Chris Amstutz

Businesses across the country are taking notice of the rapidly changing power generation mix. Is it simply due to the sight of wind and solar farms popping up along the highway? No, rather it is due to something more vital: their bottom line. From California, to Texas, to the Northeast, the impacts of an increase in power generation from renewable sources and a decline in coal-fired power are being felt. What lies on the river ahead? Recent news and pricing movements across the U.S. are showing signs of a straining grid, primed for increased volatility. Volatility presents opportunity in the energy industry and Choice Energy Management is working to remove the blindfold and safely guide your business to a stream of savings (a more enjoyable experience than re-watching Netflix’s “Birdbox” movie). Our first blog post of the roaring 20’s turns the rudder against the stream to dissect the current path for regional power market structures.

Nationally, we have seen a huge shift in the generation mix since 2014. While the chart above gives the breakout in terms of percentage change for each source of electricity, it does not fully tell the story for what is happening in power markets across the United States.  The introduction of intermittent electricity assets to the grid has posed new concerns and challenges that need to be addressed. More plainly speaking, when the wind doesn’t blow and the sun doesn’t shine, how will the electricity grid adapt to keep up with the power demands of end users. Without diverging down the deep, winding stream on the physics and technical nuances of power markets, here are the regions we are monitoring more closely for volatility in 2020:

CAISO: The push towards a Renewable Portfolio Standard for California of 50% by 2030 continues. The state legislature has remained hostile towards fossil fuel and nuclear generation assets. Many believe that the state government is challenging the grid too hard and too fast. The three main utilities (PG&E, SoCal Edison and SDG&E) are all pushing for rate hikes stemming from wildfire liabilities and the increased regional cost of natural gas. This market has already seen tremendous volatility, but tensions have calmed for now.

ERCOT: The latest report on Capacity, Demand and Reserves for ERCOT has projected a 10.5% reserve margin for summer 2020. The margin is projected to loosen to 15.2% and 13% in ’21 and ’22 respectively. Lost base-load generation from coal retirements has not fully been replaced by natural gas fired units. The renewable build-out has been substantial and is expected to grow to 15% of all generation utilized by the end of 2021. Low regional natural gas prices have created a scenario where power prices are near decade lows for all but the summer months. To entice new capacity, generators will need to be profitable in all months of the year, something that is hard, given the low prices 10 out of the 12 months (see below).

PJM: The current battle between the PJM regulators and the Federal Energy Regulatory Commission (FERC) over renewable energy subsidies distorting the market will likely not be solved soon. FERC’s latest order of expanding the Minimum Offer Price Rule (MOPR) aims to ensure competitive generation investment but may simply be an indictment of the flaws in the PJM forward capacity pricing structure.  The outcome of the expanded MOPR will likely beget more regulations from state legislatures, and PJM futures prices will be susceptible to the stroke of a pen.  

The depth of nuance affecting prices in region specific power markets is enough to make even the most avid energy blog connoisseurs head spin. The topics discussed in this blog warrant much deeper discussions than the individual paragraphs present. From 2014 to today, the soft trickling whisper generated from the impact of renewables has grown to a small but roaring stream. Time will tell how choppy the waters will get but there is no denying the potentially volatile effects of incorporating renewable energy into regional ISO’s. Until the day analyzing power markets becomes black and white, see what more Choice! can do to ensure smooth sailing.

Confidential: Choice Energy Services Retail, LP.

Strange Times: Natural Gas Storage Level

By: Chris Amstutz

The fall season inherently breeds uncertainty. Questions like, will the weather be 80 degrees and sunny, or 50 and rainy? Should I pay money to have someone scare me, or just sit at home and let the evening news do it? Or the most important, troubling question of them all, will natural gas storage levels be at unsustainably low levels to start the winter? The natural gas market is experiencing strange times. We are seeing some fundamentals experience record highs, and some record lows. Whether you’re familiar with the hit Netflix drama Stranger Things or not, there is a similarity between the show’s eerie drama, and the market movements that are being spurred by low natural gas storage levels. The fall season is full of questions, but wondering if your business is protected from potentially volatile NYMEX price movements this winter should not be one of them.

Whether you long for the nostalgic 1980 time period of the show, or a storage inventory level over 4,000 BCF, our situation is grave to say the least. We currently sit at a storage level of 2,956 BCF. That is 607 BCF below the five-year average, and 627 BCF below last year. We started the injection season at 1,281 BCF in storage, but bearish sentiments were abounding at the time with production setting new records then, and nearly every week since (7-12 BCF/Day above the five year average). Unfortunately, several summer fundamentals, previously discussed in our Bulls and Bears Reports, made up that difference on the demand side, preventing the needed storage injections. Similar to Dart the underfed pollywog, we have only averaged a weekly injection of 81 BCF this year, as opposed to the five-year average of 82 BCF. The EIA expects the storage level to get up to 3,263 BCF (lowest level since 2005), but many projections are lower.

So what is the implication of the natural gas market being in the ‘Upside down’ world? In a word, volatility. For most of 2018 we have seen intraday prompt month trading ranges of 5-10 cents. This has now increased to 10-15 cent ranges, and could become larger the closer we get to winter. The NYMEX 2019 Calendar strip has increased $0.20/MMBtu in the last month, on concerns for this winter. Supply constricted areas such as the Northeast and West Coast may experience even larger swings, depending upon the weather. While there is always the chance for this situation to moderate in the coming weeks, the fear of the unknown is currently showing up as a premium in pricing for this winter.

This time of year does not have to be genuinely scary, especially for those dependent upon the natural gas market. Whether storage levels or production records are in control, the market fundamentals are always in flux, and it takes a trained analyst to see what’s coming next. With a flexible, comprehensive suite of energy management solutions, Choice Energy Services can help you keep the natural gas market demogorgons at bay.

Confidential: Choice Energy Services Retail, LP.