Winter Forecasts (Not So) Set In Stone: Remastered

By: Chris Amstutz

This blog was originally posted Nov. 14, 2017 and has been updated to reflect the current 2021-2022 forecast. “Humor” has been updated for the times. The winter of 2018 (after this original blog) brought a month long January polar vortex event that spiked natural gas prices 40%.

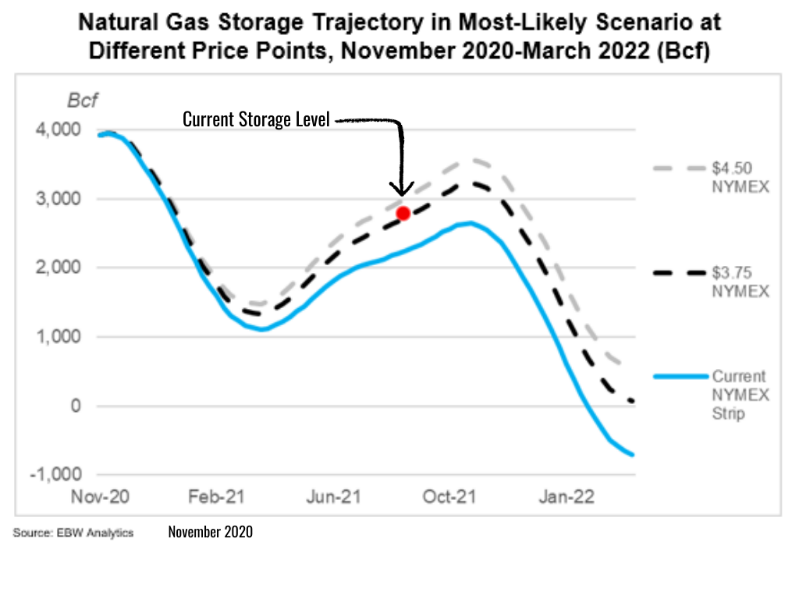
With thousands of years of human technological advances you would think your local weatherperson could prepare everyone for the upcoming winter. Winter is coming (insert your favorite Game of Throne meme here) and unfortunately forecasts more than 7 days out are still iffy from most meteorologists. That is why many would rather trust folklore prediction methods or the Farmer’s Almanac, instead of the Weather Channel. No matter the source of your winter forecast, Americans want to prepare themselves for the upcoming winter. For those in the energy industry, we want to get an idea on how much natural gas will be needed for heating demand. A very cold winter (i.e. Polar Vortex in 2014 & 2018 right after this blog was originally published) can increase prices for natural gas, while mild winters (like the last two) can decrease prices. The EIA has already put their line in the sand, stating that costs for businesses will be 20-40% higher this winter, depending on the weather. With long term winter prediction methods still as unpredictable as your drunk uncle at Thanksgiving dinner, let’s look at some other weather models (both Old & New) and see what they are forecasting for winter 2021-2022.

The Old Approach

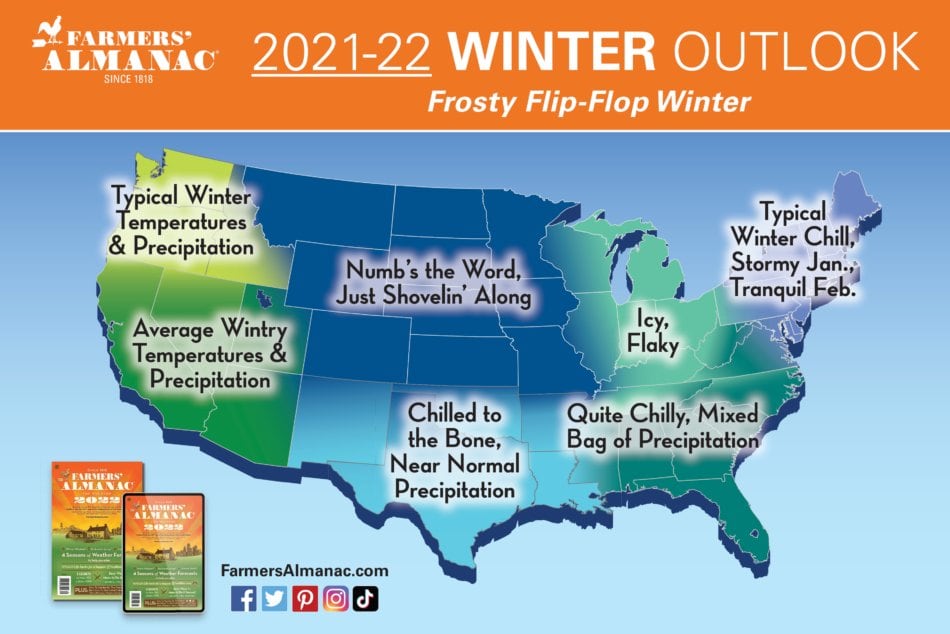
While many in the scientific community scoff at The Farmer’s Almanac, there is still something to be said for a source that bases predictions on observed events in the natural world. Folklore stories that predict harsher winters include: increased abundance of acorns, early geese migrations, heavy fogs in August, and Wooly Bear caterpillars that have blacker fuzz. The almanac’s overall predictions call for a colder, wetter winter for most of the U.S. and regional predictions can be seen below. The almanac boasts an 80% accuracy rate for predicting long term weather, but predictions are often vague, without data, and more opinionated than a 2017 Donald Trump discussion with your dear Aunt Sally (or today as confusing as a Joe Biden press conference).

The New Way

Back to the Future II predicted us knowing near term weather conditions down to the second by 2015.  While this hasn’t come true (like flying cars and hoverboards), forecasting has dramatically improved and scientific modeling can forecast 7-10 days in advance with close accuracy. Winter trends and modeling techniques examining “teleconnections” are generally accepted and comparisons to data from previous years are a huge component. The El Nino Southern Oscillation (ENSO) teleconnection is heavily monitored for the U.S. and this year (like 2018) has a 75% chance of “La Nina” (yes, it means “the little girl” in Spanish). This normally indicates a higher chance for a colder winter for much of the country but the National Oceanic and Atmospheric Association predicts its’ effects to be mild for this winter (see below). Another technique includes the analysis of pressure systems or “blocking” patterns (great fall football term) that could shelter or expose the U.S. to arctic air. The indications are neutral for this winter but could still change going forward.

Extended weather forecasting has definitely improved over the years. However, with so many changing variables, extended forecasts still have a long way to go before we can count on them. Until accuracy improves, many will still trust nature’s signs over weather models provided by meteorologists. Regardless of your source for future weather, the analysts at Choice Energy Management will continue to provide our clients with weather data from several sources in our monthly Bulls & Bears report. We recognize the value in predicting natural gas pricing in the winter and are working hard to keep your company from being left out in the cold (literally and financially).

Confidential: Choice Energy Services Retail, LP.

Risky Business: A New Era in Energy

By: Chris Amstutz


Natural gas and electricity markets are going through a fundamental change. These markets are coming of age and the idea of prices falling in the future is as innocent as a young Tom Cruise picking a fight with a hustler. Gone are the days of U.S. prices being sheltered from global influences, and here to stay is complex market structures with extreme price risk. Youthful exuberance, ignorance, and financial loss may be themes of the movie Risky Business, but they need not be adjectives describing your business’s energy risk strategy. This blog will point back to our past risk management pieces to highlight just how risky this energy business can be.

In November 2020, we published a client-directed analysis of the NYMEX natural gas market and potential vulnerabilities heading into Winter. Our “Case for $5.00 NYMEX Natural Gas” largely agreed with EBW Analytics in that prices had the potential to rise substantially in the wake of COVID-19 induced supply destruction. It has been 10 months since this report and prices have behaved as predicted, rising over 100% to the $3.75 – $4.50 range. The storage level is also in line with these predictions, indicating that we will finish nearly 10% below five-year average levels. The COVID-19 induced chain of events have slid in wearing white socks, jamming out to “Old Time Rock and Roll” and a warm winter could be the only party stopper.

An example of the extreme nature of pricing at this time can be seen in Global Liquified Natural Gas (LNG) prices. All time highs in Europe and Asia are robbing businesses and end users worse than Joel Goodman was robbed of his Mom’s Steuban glass crystal egg (and furniture). We mentioned the phenomena on LinkedIn here, and we discuss pricing on our LNG Monthly Update. Global prices have had a high correlation (0.95) to NYMEX Natural Gas prices in the last 3 months, and it is no secret we have entered in to a global era for natural gas. As U.S. exports climb to 12.5 Billion Cubic Feet per Day, these high global prices could lift NYMEX prices higher in 2022-2023.

The largest fundamental we see affecting the power markets in the next two years is the impact of renewable energy. The rate at which solar and wind generation have been incorporated in to the market has been staggering, with ERCOT alone topping 7,000 peak megawatts of solar and 20,000 peak megawatts of wind, totaling 15-20% of generation in the market. However, like running a brothel at your parent’s house in the movie Risky Business, we worry that regional power ISO’s have not fully priced in potential costs/consequences, stemming from such a rapid shift in generation. In the Pennsylvania/Jersey/Maryland (PJM ISO) and California ISO (CAISO), we are already seeing cracks in the market structure, revolving around the value of reliability given from coal and natural gas fired generation. While Choice! takes no stance on the morality of generation sources, we want to highlight that with any big change, there may be unforeseen costs in the future. Reviewing your risk tolerance for future power prices can help mitigate future price increases in the changing world.

Choice! Energy Management never claims to know all of the answers but we do like to point out when we are correct. The energy landscape is changing rapidly. The pandemic and politicians are working overtime to make energy topics complex, and we aim to make them simple. The movie Risky Business is a comedic look at a high-school boy coming of age and figuring out the world. The examples above are meant to paint a simple picture of the untold complexities in energy markets, and it is our mission to help your business figure out the energy world. The consultants at Choice! Energy Management are here to guide you through these complexities, saving your business money.

Related Blogs:

LNG Windfall Winners – Not the Usual Suspects

New Year Same Crazy: Regulatory Changes for Energy

Holiday Movies as Natural Gas Fundamentals

LNG Windfall Winners – Not the Usual Suspects

By: Matthew Mattingly

https://giphy.com/gifs/snl-saturday-night-live-season-44-5bkpoGHpV6TePeyKFd

The ever-changing energy landscape has proven its prowess again with the recent evolution of Liquified Natural Gas (LNG) markets. Staying ahead of these trends requires a voracious reader willing to scour articles, blogs, and even Twitter. Books are slightly less of a requirement yet, I recently found myself reading Meghan L. O’Sullivan’s recent published book, Windfall. The book discusses in great detail the benefits that the fracking revolution (not my favorite expression) has had in the United States, and the domino effect it has had on the rest of the world. The globalization of gas markets through LNG has created winning countries and losing countries (including our shirtless Siberian friend), and the implications are numerous. This book reminded me of how much the U.S. natural gas market has changed in my 15 years in the industry. For these reasons, Choice! Energy Management closely tracks LNG metrics and provides monthly commentary on how news in far away lands can now affect Risk Management strategies for our clients.

Winner: China

Napoleon famously said “China is a sleeping giant. Let her sleep, for when she wakes, she will move the world.” China has awoken and is now a fierce dragon.  China’s growth in the 21st century is remarkable, with now the second largest GDP requiring large sums of fossil fuels that it does not possess within its borders.  The book Windfall discusses China’s initial “going out” strategy of investing in production in Latin American and African countries. In the meantime, China’s booming economy collided at a perfect time with the United States’ fracking boom, allowing for robust LNG imports. China now has access to the United States’ 12 BCF/Day of LNG capacity, when in previous times they suffered shortages. Demand has still outpaced supply in the LNG world, leading to prices of $12 – $20/MMBtu for China, compared to roughly $3/MMBtu in the U.S.  This cost will continue to fall as natural gas markets globalize bringing prices closer together.

Winner: Europe

Many European nations would prefer to move away from natural gas due to climate policies, but demand is still strong. Even as a “bridge fuel” to carbon neutral goals by 2050, the EU will be burning 550 billion cubic meters annually in 2021 through 2025.  Supply is heavily dependent on Russian imports (over 40% of Europe’s natural gas supply).  With such a strong reliance on Russia’s fossil fuels, European nations have been reluctant to fight Russia/Putin on policy conflicts (see Ukraine gas conflicts/cuts in 2006, 2009, and again in 2013). However, with a growing supply of LNG available, Europe has a new partner in the natural gas supply game. Europe can now diversify their natural gas imports, with the United States becoming a larger player. Windfall projects the United States to represent 18.9% of Europe’s gas imports by 2025. If nothing else, the additional LNG supply provides Europe negotiating ground against Russia, as recently seen with Nord Stream 2 pipeline.

Loser: Russia

To say Russia relies on fossil fuels would be understatement. Oil and natural gas account for more than 60% of Russia’s exports and provide more than 30% of the country’s GDP. The last thing the former Soviet Motherland wants is an oil and gas competition, but that is what it is getting thanks to the United States shale revolution.  In a similar fashion to the oil price collapse in 2014, U.S. LNG is gaining global market share, pushing prices lower. This is hindering Russia’s leverage on pipeline project negotiations like Nord Stream 2 to Europe and Power of Siberia to China. Additionally, it is causing delays in their own LNG export terminals (Valdivostok LNG Project). These pipeline and LNG projects are being reviewed as the financial benefits to Russia are not as strong, thanks to U.S. competition. 

Choice Energy Management – LNG Monthly Update

LNG exports have been a game changer for the U.S. natural gas market, and also for the rest of the world. This has not been lost on the team at Choice! Energy Management, as we have written about the topic for years. To highlight the growing trend, Choice! now provides a monthly LNG Report to its Risk Management clients, showing export levels, U.S. export terminals, and global hub prices. You can access the LNG Monthly Update here or talk to your consultant on how to gain access to the report.